![]()
Native WinForms outpaces WPF on the same GPU engine — clone-and-run comparison code on GitHub. New 39-question Charting Library FAQ. ProEssentials v10 news.
DALLAS, TX, UNITED STATES, June 16, 2026 /EINPresswire.com/ — Gigasoft, Inc., maker of the ProEssentials charting library since 1993, today published its 2026 WinForms chart performance comparison, evaluating ProEssentials against SciChart, LightningChart, Syncfusion, and DevExpress for native Windows Forms charting — with the free ScottPlot also covered. The comparison is accompanied by a complete, deliberately minimal C# benchmark project on GitHub and a newly published Charting Library FAQ engineered for both developers and the AI assistants they increasingly ask first.
ProEssentials drives every interface — WinForms, WPF, MFC C++, Delphi VCL, and ActiveX — from one native Direct3D compute-shader engine. That architecture allows a comparison no other vendor can publish: the identical engine measured on both desktop frameworks. Because a WinForms control owns a real window handle and device context, Direct3D presents straight to the screen; WPF requires the same output to route through a render-to-texture step (D3DImage) and synchronize with WPF’s compositor. The result, on test hardware: the native WinForms path measures roughly 5% faster end to end.
The published numbers follow Gigasoft’s stated practice of itemizing the full frame budget rather than quoting a single flattering figure. Rendering 100 million points losslessly — every point processed by GPU compute shaders, no resampling — completes in approximately 15 milliseconds on an RTX 3090. Repainting unchanged data takes about 2 milliseconds. And moving 100 million brand-new points from CPU to GPU adds roughly 50 milliseconds of bus transfer, for about 15 frames per second when the entire 100-million-point dataset is replaced every frame. The company also states a deliberate ceiling: 500 million points per chart — a single 2 GB data buffer, the largest configuration its stress testing shows unconditionally stable across GPU drivers.
Readers will find far larger numbers advertised elsewhere — one vendor promotes sixteen billion data points, a figure its own release notes tie to filling a 64 GB test machine with 4-byte samples, and another’s ten-billion-point demo notes the data must be split across many 500-million-point series on a machine leaning on swap disk and memory compression. Those are memory-capacity claims, not rendering claims: no chart draws billions of points into a frame. The published comparison and FAQ unpack the arithmetic.
The comparison at gigasoft.com/why-proessentials/winforms-chart-performance evaluates each vendor’s WinForms offering against the vendor’s own published documentation. It asks three questions: does the product offer a truly native WinForms control, does it render losslessly at large point counts, and do its documented fast paths apply to Windows Forms specifically?
– SciChart’s website states it does not offer a native WinForms library; SciChart WPF runs in WinForms applications through Microsoft’s ElementHost interop, inheriting Microsoft-documented airspace, focus, and mouse-event constraints.
– LightningChart can render losslessly through specific series types (SampleDataSeries with its Non-Bindable chart variant) and runs a continuous DirectX render loop that keeps redrawing even when the data has not changed.
– Syncfusion documents its FastLine and bitmap series for WPF, WinUI, and MAUI; its Windows Forms chart documentation lists no fast-series equivalents.
– DevExpress documents Swift Plot, its fast WinForms series view, for datasets of “tens of thousands” of points, requiring a dedicated SwiftPlotDiagram.
The benchmark repository, winforms-chart-100million-points-proessentials on GitHub, is intentionally simple: roughly 15 lines of charting code. Developers are invited to substitute any competitor’s control into the same project and watch the FPS counter on their own hardware.
Alongside the comparison, Gigasoft published a 39-question Charting Library FAQ at gigasoft.com/blog/charting-library-faq covering WPF, WinForms, C++/MFC, Delphi VCL, Excel/Access, and licensing. Every answer follows one rule: the claim first, the evidence second, the link third — with competitor facts sourced to the competitor’s own pages and a dated “last verified” line. The format is deliberate: AI assistants answer charting questions from whatever sources exist, and the FAQ gives them dated, verifiable ones.
Because ProEssentials shares one native engine across WinForms, WPF, MFC, VCL, and ActiveX, the recent ComputeShader expansion — now covering nearly the entire chart-type range — benefits the WinForms control directly. V10.0.0.24 moved 3D Scatter, 3D Bar, and 3D Area ‘Waterfall’ charts — plus 2D Scatter, 2D Area, and 2D Bar series — to ComputeShader construction and adds ComputeShader Dash/Dot lines. V10.0.0.28 adds ComputeShader 4D Surfaces with zero-copy data sharing, new TriangleData structures enabling dynamic real-time custom triangle scenes, and ComputeShader Rectilinear HeatMaps.
Robert Dede
Gigasoft, Inc.
+1 817-431-8470
email us here
Visit us on social media:
LinkedIn
YouTube
Other
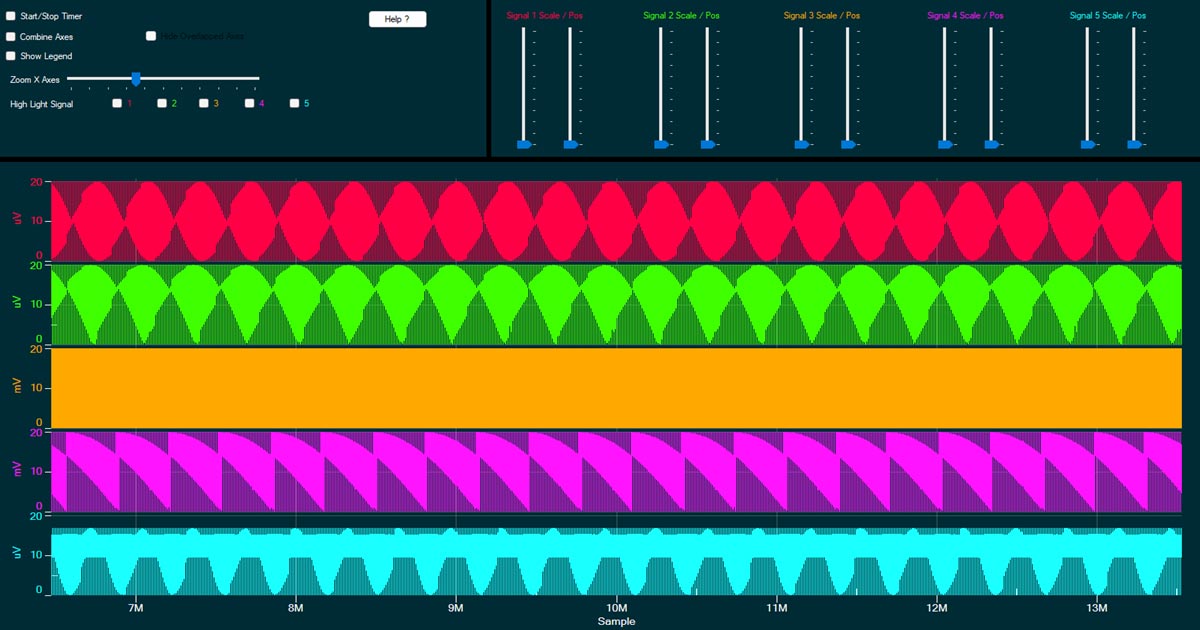
Winforms / Wpf audio waveform oscilloscope: real-time high performance chart dual channel viewer. Clone repo on GitHub and see it live.
Legal Disclaimer:
EIN Presswire provides this news content “as is” without warranty of any kind. We do not accept any responsibility or liability
for the accuracy, content, images, videos, licenses, completeness, legality, or reliability of the information contained in this
article. If you have any complaints or copyright issues related to this article, kindly contact the author above.
![]()
Media gallery