Cotality™, a leader in property information, analytics, and data‑enabled solutions, today released its Home Price Index™ with April 2026 data. Home price growth continued its slow but steady increase of 0.4% year-over-year for the second month. Cotality data reveals home prices have risen 0.8% since the beginning of 2026, a jump that is below average for recent years. The recent surge in mortgage rates has disrupted the spring homebuying season and reversed some of the affordability gains created by the lower rates seen throughout 2025.
This press release features multimedia. View the full release here: https://www.businesswire.com/news/home/20260602494630/en/
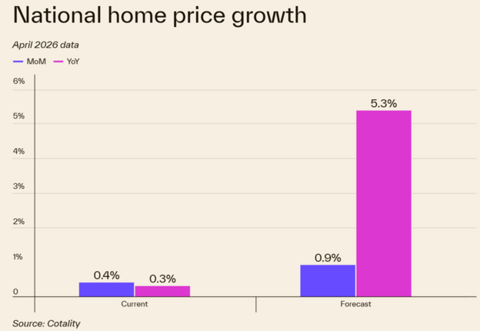
Cotality’s National Home Price Index for April 2026 and the forecasted year-over-year growth in 2027.
“Market strength suggests that some buyers remain insulated from mortgage-rate volatility and are supported by substantial home equity and stock market gains,” said Cotality Chief Economist Dr. Selma Hepp. “Meanwhile, markets that depend more heavily on traditional mortgage financing and rate-sensitive buyers are seeing prices stay relatively flat. Overall, fewer markets posted year-over-year price declines in April than in prior months, pointing to continued stabilization across the housing market.”
Florida topped the list of markets with an annual decline in home prices, and several other major housing markets saw prices slow as well. When looking at the 3-month change in prices through April, the New York City metro area dropped -2.3%; Buffalo, NY was down -2.1%; Washington D.C. declined -1.3%; and Fresno, CA; Nassau, AZ; and Phoenix, AZ all posted declines.
These decelerations suggest that markets that experienced recent rapid appreciation may be adjusting to the higher mortgage rate environment and an affordability ceiling.
In contrast, several markets are displaying accelerated growth and demonstrating strengthening fundamentals. These powerhouse markets are led predominantly by Midwest industrial hubs including St. Louis (+4.1%), Kansas City (+4%), and Milwaukee (+3.6%), parts of the Northeast – Newark, NJ (+6.4%), Rochester, NY (+5.9%), Boston, MA (+4.9%), Cambridge, MA (+4.8%), and Bridgeport, CT (+4.7%) all posted robust 3-month spring price gains. We also saw growth select coastal metros – San Francisco saw a strong 3-month HPI change of 8.1%. While Los Angeles, San Jose, and Portland are all now considered ‘undervalued’ while New York City takes on that title for the East Coast.
Top Takeaways:
- U.S. single-family home prices increased by 0.3% year over year in April 2026 compared with April 2025. On a month-over-month basis, home prices increased by 0.4% from March 2026.
- Cotality’s forecast shows annual U.S. home price gains increasing to 5.3% year over year in April 2027.
- San Francisco posted the highest year-over-year home price increase of the country’s 100 largest metro areas in March, at 8.3%. Newark, NJ, saw the next-highest gain at 7.6%.
- Among states, Maine saw the most annual growth in March, increasing by 7.3%. It was followed by Illinois (5.7%), Nebraska and Connecticut (5.1%), and New Jersey (54.9%).
- 11 states showed negative home price appreciation in April 2026. South Dakota (-3.4%); Hawaii (-2.8%); Washington, D.C. (-2.5%); Florida (-1.6%), and Washington (-1.5%).
- The top markets at risk for price declines in the next 12 months, according to Cotality’s Market Risk Indicators include: Cape Coral–Fort Myers, FL, Greenville-Anderson-Greer, SC; Lakeland–Winter Haven, FL; Marietta, GA, and Tampa, FL.
- According to Cotality’s Market Condition Indicators, 69 of the largest 100 metros are currently overvalued, meaning their current home price indexes exceed their long-term values by greater than 10%, while 23 are normal and 7 are undervalued.
The next Cotality Home Price Index will be released on July 7, 2026, featuring data for May 2026. For ongoing housing trends and data, visit the Cotality Insights blog: www.cotality.com/insights.
Methodology
The Cotality HPI™ is built on industry-leading public record, servicing, and securities real-estate databases and incorporates more than 45 years of repeat-sales transactions for analyzing home price trends. Generally released on the first Tuesday of each month with an average five-week lag, the Cotality HPI is designed to provide an early indication of home price trends by market segment and for the Single-Family Combined tier, representing the most comprehensive set of properties, including all sales for single-family attached and single-family detached properties. The indices are fully revised with each release and employ techniques to signal turning points sooner. The Cotality HPI provides measures for multiple market segments, referred to as tiers, based on property type, price, time between sales, loan type (conforming vs. non-conforming) and distressed sales. Broad national coverage is available from the national level down to ZIP Code, including non-disclosure states.
Cotality HPI Forecasts™ are based on a two-stage, error-correction econometric model that combines the equilibrium home price—as a function of real disposable income per capita—with short-run fluctuations caused by market momentum, mean-reversion, and exogenous economic shocks like changes in the unemployment rate. With a 30-year forecast horizon, Cotality HPI Forecasts project Cotality HPI levels for two tiers — Single-Family Combined (both attached and detached) and Single-Family Combined Excluding Distressed Sales. As a companion to the Cotality HPI Forecasts, Stress-Testing Scenarios align with Comprehensive Capital Analysis and Review (CCAR) national scenarios to project five years of home prices under baseline, adverse and severely adverse scenarios at state, metropolitan areas and ZIP Code levels. The forecast accuracy represents a 95% statistical confidence interval with a +/- 2% margin of error for the index.
About Market Risk Indicators
Market Risk Indicators are a subscription-based analytics solution that provide monthly updates on the overall health of housing markets across the country. Cotality data scientists combine world-class analytics with detailed economic and housing data to help determine the likelihood of a housing bubble burst in 392 major metros and all 50 states. Market Risk Indicators is a multi-phase regression model that provides a probability score (from 1 to 100) on the likelihood of two scenarios per metro: a >10% price reduction and a ≤ 10% price reduction. The higher the score, the higher the risk of a price reduction.
About the Market Condition Indicators
As part of the Cotality HPI and HPI Forecasts offerings, Market Condition Indicators are available for all metropolitan areas and identify individual markets as overvalued, at value or undervalued. These indicators are derived from the long-term fundamental values, which are a function of real disposable income per capita. Markets are labeled as overvalued if the current home price indexes exceed their long-term values by greater than 10% and undervalued where the long-term values exceed the index levels by greater than 10%.
The data provided are for use only by the primary recipient or the primary recipient’s publication or broadcast. This data may not be resold, republished or licensed to any other source, including publications and sources owned by the primary recipient’s parent company without prior written permission from Cotality. Any Cotality data used for publication or broadcast, in whole or in part, must be sourced as coming from Cotality, a data and analytics company. For use with broadcast or web content, the citation must directly accompany first reference of the data. If the data are illustrated with maps, charts, graphs, or other visual elements, the Cotality logo must be included on screen or website. For questions, analysis or interpretation of the data, contact Charity Head at newsmedia@Cotality.com. Data provided may not be modified without the prior written permission of Cotality. Do not use the data in any unlawful manner. The data are compiled from public records, contributory databases and proprietary analytics, and its accuracy is dependent upon these sources.
About Cotality
Cotality accelerates data, insights, and workflows across the property ecosystem to enable industry professionals to surpass their ambitions and impact society. With billions of real-time data signals across the life cycle of a property, we unearth hidden risks and transformative opportunities for agents, lenders, carriers, and innovators. Get to know us at www.cotality.com.
View source version on businesswire.com: https://www.businesswire.com/news/home/20260602494630/en/
Media gallery